Am I being stupid here?
All I want is to have a function that coresponds to the following graph:
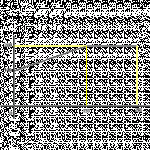
The straight line cuts the axis at (0,140) and then carries on up to (150,200). Once the straight line has reached this upper point of (150,200) it then stays x value then stays at 200. I've attached a quick sketch of the graph.
Here is the equation I was using, the first bit is correct and works fine but when I add the function to cap the value at 200 it gets confused:
--------------------------
b3 = b1 * 60/150 + 140 'this bit is correct
if b3 =>199 then goto max1 ' this bit confuses things
max1:
b3 = 200
pause 50
------------------------
Any suggestions? I I just being stupid?
All I want is to have a function that coresponds to the following graph:
The straight line cuts the axis at (0,140) and then carries on up to (150,200). Once the straight line has reached this upper point of (150,200) it then stays x value then stays at 200. I've attached a quick sketch of the graph.
Here is the equation I was using, the first bit is correct and works fine but when I add the function to cap the value at 200 it gets confused:
--------------------------
b3 = b1 * 60/150 + 140 'this bit is correct
if b3 =>199 then goto max1 ' this bit confuses things
max1:
b3 = 200
pause 50
------------------------
Any suggestions? I I just being stupid?
Attachments
-
 1.8 KB Views: 9