Maths ADC and non linear formula help.

retepsnikrep

Senior Member
Another maths question.

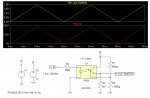
I have an adc connected to a HV supply via a non linear isolation circuit.

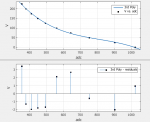
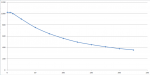
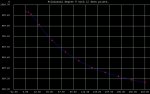
It produces the below 10bit ADC readings at the given input voltage.
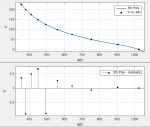
That works fine but i want to create a formula from these data points to allow the adc to produce the actual voltage.
I don't want to use a lookup table if possible.
Accuracy to 1V is acceptable. There should be enough adc resolution to do that with the right formula.
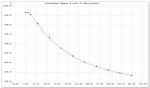
225v = 356
200v = 380
175v = 412
150v = 450
125v = 495
100v = 561
75v = 644
50v = 753
25v = 903
10v = 1000
5v = 1020
0v = 1023

How to convert that data into some sort of forumla to produce the voltage from a given adc reading.
I'm sure I've seen something like this done on excel?
Produce a graph from the data and then it creates a formula? Sorry i'm no excel expert.
It's not linear.

Thanks
 

hippy

Ex-Staff (retired)
http://www.xuru.org/rt/PR.asp

http://www.arachnoid.com/polysolve

The last is handy as it draws a graph!

Added: It also has a table generator so you can use the most complicated / best-fit equation without worrying that it would be impossible to implement. It may require a bit of editing but saves an awful lot of work in creating a lookup table.

Probably others out there as well.
 
Last edited:

Billo

Senior Member
That's not only non-linear, but it also seems to be all over the place especially that 75v-50v-25v-0v sequence.

Can you give us more information on that non-linear isolation circuit, as I do not think that response will be simple to model mathematically within a volt?


Added: As I expected, according to that plotting site, you'd need a 9th degree polynomial to model this so that the error is better than 1V over the entire range. The plot below shows the data fitted to a 9th degree polynomial.
 

Attachments

Last edited:

srnet

Senior Member
Could you draw a graph of the results and post a screen shot ?

Probably far more recognizable to forum watchers as a graph than series of numbers.

And when you say 'non-linear' could you perhaps explain the interface ?

Is it just random ?
 

Svejk

Senior Member
Fuzzy logic might result into a better fit. I'll have a look later today or tomorrow morning for a solution if you can wait. Fitting data requires more information, can you repeat your measurements about 10-15 times and provide a spreadsheet?
 

geoff07

Senior Member
What is the underlying mechanism? Is 1V precision really needed? Apart from the kink at the end it looks like a sideways quadratic to me. Maybe a simple curve would do the job rather than a long polynomial?
 

g6ejd

Senior Member
It looks to me like your voltage source is from a relatively high impedance or your measuring circuit is loading the voltage source, same thing really! As voltage increases your reading differential drops indicating your measuring circuit is not high enough impedance.

What is your connection to the voltage source, if via a resistive divider, then try taking the same values and increasing them by the same factor, so for example 4.7K becomes 47K and 47K becomes 470K, then measure again.
 

premelec

Senior Member
Despite Westy's admonitions about sticking to original quest - I'd like to know what the "nonlinear isolation circuit" consists of.... [perhaps to avoid using it... :)]
 

g6ejd

Senior Member
A reasonable match is y = 302.1e^(0.1104.x) but that does not help a lot unless you have a floating point unit connected to the PICAXE.

In Excel, you'd graph your data, then select your curve, then add a trend-line, select the type, OK, then double-click trend-line, then tick formula...

This is a slightly easier one to programme:

y = 2.7195x^2 + 35.748x + 286.75

say:

Y = 27 x (X x X) + 36 x X + 287

You'd need to work out the PICAXE precedence though... :)
 

retepsnikrep

Senior Member
Please be gentle on me. ;)
It's a NSL32 led/ldr opto isolator. Ok I know it's crap. I may try a simple npn transistor opto isolator next.
The led input is driven from the 0-250v input via a 200k resistor.
The ldr output forms the lower part of a voltage divider with a 1k pullup to +5v
The voltage divider ouput is fed into the pic adc via a 0.1uf smoothing cap.

Cheapness and simplicity was the ultimate aim. Accuracy is a secondary consideration. +/-2V may be enough.
I'm happy to listen to other ideas and appreciate the help with the maths.

Sounds like I need to increase the output pull up resistance or the HV input resistance and take some more readings with known voltages.

Havng seen the data table generated by those useful links I may well use the 8 bit adc and a 255 byte 9th polynomial lookup table.
The 0-10V range kink is not critical and can be ignored. 1v accuracy between 10-250v would be good.
 
Last edited:

premelec

Senior Member
Very good...there may be temperature coefficients to deal with as well - there are units with 'matched' components on each side of the isolator so you can put current through the low side to 'null' [match] the high side - I don't know if the NSL32 is such a beast - I've only seen this in routine opto isolators rather than LDR... anyhow have fun - and stay isolated!
 

Goeytex

Senior Member
I may try a simple npn transistor opto isolator next.
If you are considering an NPN opto and "cheap" is your primary specification then have a look at the 4N25. < 50 cents here in the States. The attachment below show one way of doing what you want. I added some bias to the OPTO to get the signal above ground to make reading easier. I maxed the signal at about 2v to allow using FVR /ADC to be configured at 2.048V for good resolution.

This is a SPICE simulation based upon an ideal model of the 4N25. It is likely that you will need to tweak the component values a bit to get the same results.

If you remove the two bias resistors the output will be from about 0v to 4.70 volts ( Emitter Follower) but there will be some added non-linearity at the lower range.

I suggest making R2 a 1/2 Watt resistor since it will get warm at 250 volts
 

Attachments

premelec

Senior Member
Apparently the 'ideal model' has LED diodes conducting at 0 volts... oh how we wish this was the case! :)
 

KeithRB

Senior Member
I would just take the original table and interpolate between points. You may need to gather more points at the highly nonlinear parts in order to get the 1 V accuracy.

You might get an external eeprom and store a table with all 1023 points and the resulting voltages.
 

hippy

Ex-Staff (retired)
Cheapness and simplicity was the ultimate aim. Accuracy is a secondary consideration. +/-2V may be enough.
I'm happy to listen to other ideas and appreciate the help with the maths.
Perhaps an indication of the application or what it's all to achieve would help, over what range of voltages is what accuracy required ?

+/-2V is still reasonably demanding with respect to a 0V-250V signal. Simple, cheap and accurate are often three corners of a triangle without a perfect solution which can deliver all three together.
 

Svejk

Senior Member
Some points to note:

1. The independent variable (x-axis in our case) is ADC reading and not the voltage. That is, we are reading ADC and try to calculate the voltage.
2. The data sampled for the low voltage values are not at the same interval(5V, 10V, 15V) as higher voltages (25V)

As such, excluding the 5 and 10V readings from data fitting and using ADC as independent variable a 3rd order with residuals values in the interval [-2.0, 3.4]. The coefficients for this fit are:

f(x) = p1*x^3 + p2*x^2 + p3*x + p4
p1 = -14.15
p2 = 39.84
p3 = -71.81
p4 = 85.3

Fitting a 5th order polynomial yields a fit with residuals values in the interval [-0.9, 0.7] which is within the original specifications.

f(x) = p1*x^5 + p2*x^4 + p3*x^3 + p4*x^2 + p5*x + p6
p1 = -3.72
p2 = 10.76
p3 = -14.75
p4 = 25.78
p5 = -69.23
p6 = 87.94

A note of caution using those fits: data fitting is a statistical method, those fits are based on a single set of data. A more accurate and less error prone fit would be achieved using a larger set of data.

3rd_Poly.png5th_Poly.png
 
Top