Hi OF,
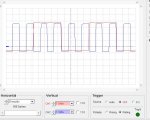
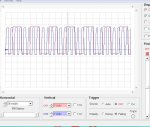
Those waveforms just look like square waves at 6Hz + 25Hz and 16Hz + 64Hz. How are the two different components (red + blue traces) actually connected to the amplifier/speaker? I would not expect them to produce a "realistic" diesel sound. However, those waveforms could be easily created with a PICaxe, using something like:
High pin1 : Pause 15 : Low pin1 : Pause 15 : High pin1 : Toggle pin2 : Pause 14 : .... etc. in a loop.
But I suspect that the complete waveforms are more complex. You may need to use a slower timebase and/or with NO trigger (i.e. "free running") and maybe in single-shot mode. Note that square waves like that might also be examined with the logic analyser mode (which can have a longer timebase).
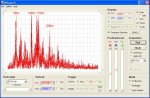
The sound on the model "tug boat" video does seem good: what I hear/see is a
constant frequency around 300 Hz (simulating a resonance in the exhasut system?) which is modulated by a lower frequency and/or pulses of noise. The new "mark2" version of the comercial unit does seem much more sophisticated, and reading between the lines I think it's using a "Class D" (switching mode) power amplifier, which is quite an innovative technique (although I did work with them 40+ years ago
")
.
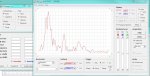
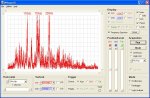
How do I interpretate the Frequency Spectrum
First, perhaps I should mention that the "Frequency Spectrum" (FFT) display uses the
same data as the normal 'scope trace, but presented in a different way. So it's important that the original "time domain" waveform is sensible, i.e. of sufficient amplitude but not clipped (i.e. past the top or bottom of the screen) and triggered (or not) as appropriate.
The "Frequency Spectrum" is basically a histogram of the frequencies which are present in the waveform, from zero (at the left-hand-side) with a linear scale up towards half the digital sampling rate (at or past the right-hand side). So a "peak" in the display indicates that the frequency is present (as a sine wave). Specific waveforms have a particular "signature", for example a 1 kHz pure sine wave appears as a single peak (or spike), but a 1kHz square wave has additional peaks of reducing amplitude at 3kHz, 5kHz etc. (i.e. "odd harmonics") and a "sawtooth" waveform has reducing spikes at all harmonics (i.e. 1kHz, 2kHz, 3kHz, 4kHz, etc).
There seemed to be some confusion about the "Feedback Shift Register" in the other thread, so I wondered about reviving it; would that be a better thread to discuss FSRs ? Often FSRs are used to produce "noise" (hiss/chuff) type sounds, but the PICaxe version in that thread is a rather unusual application of a FSR. To summarise, it simply produces different pulse trains, depending on the value initially loaded. There are three patterns which repeat every 3, 7 or 21 clock cycles, the 3 (and 7) will basically sound like simple tones, the 21 loop might sound rather more intermittent.
I see that hippy has now posted more, but I haven't examined all that yet
Cheers, Alan.